Validate what you know.
Discover what you don’t.
A new way to see your events, at every level.
See the full picture. Benchmark performance across your portfolio. Make confident commercial decisions.

A new way to see your events, at every level.
See the full picture. Benchmark performance across your portfolio. Make confident commercial decisions.
You can read a show floor. You know when exhibitors are restless, when visitor energy has shifted, when a format that worked three years ago is beginning to lose its edge.
That instinct is hard-won. EPI does not replace it. It gives you a structured, consistent way to test it, scale it, and act on it with confidence.
The signals were always there.
EPI makes them visible.

EPI is a decision-making layer. It sits above the noise of operational data and gives you structured, indexed performance signals across your events and your portfolio.
A clear picture of where each event stands, stripped of ambiguity and internal bias.
The same framework applied across every event. Comparable outputs. Portfolio-wide structure.
Evidence-backed positions on what to scale, what to fix, and what to rethink.
EPI delivers structured intelligence at three levels. Board-ready summaries at the top. Granular performance signals underneath. Every output designed to support a decision.
A concise, board-ready view of your portfolio. Where each event sits. What the index is telling you. What needs attention. No interpretation required.
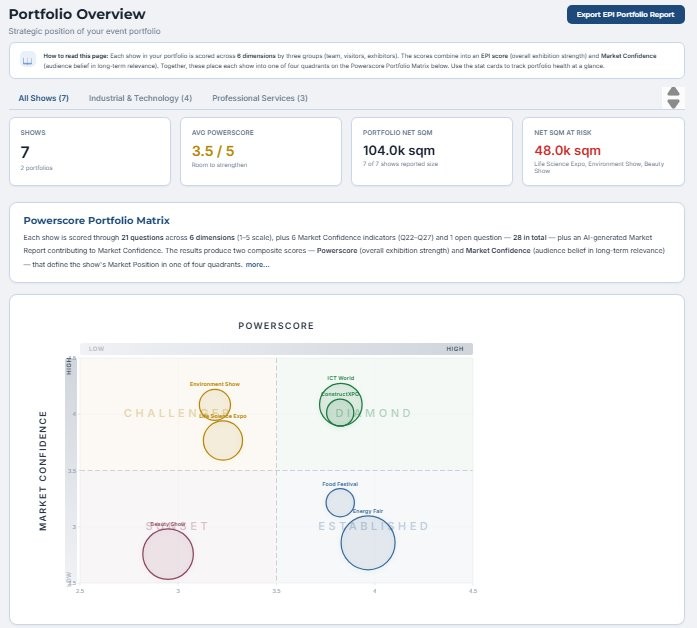
Every event plotted by Show Strength and Market Confidence. Diamonds, Challengers, Established, and Sunset positions at a glance. A tool for allocation decisions.
Pricing, retention, and growth guidance derived directly from the index. Built around what your exhibitors and visitors are actually signalling.
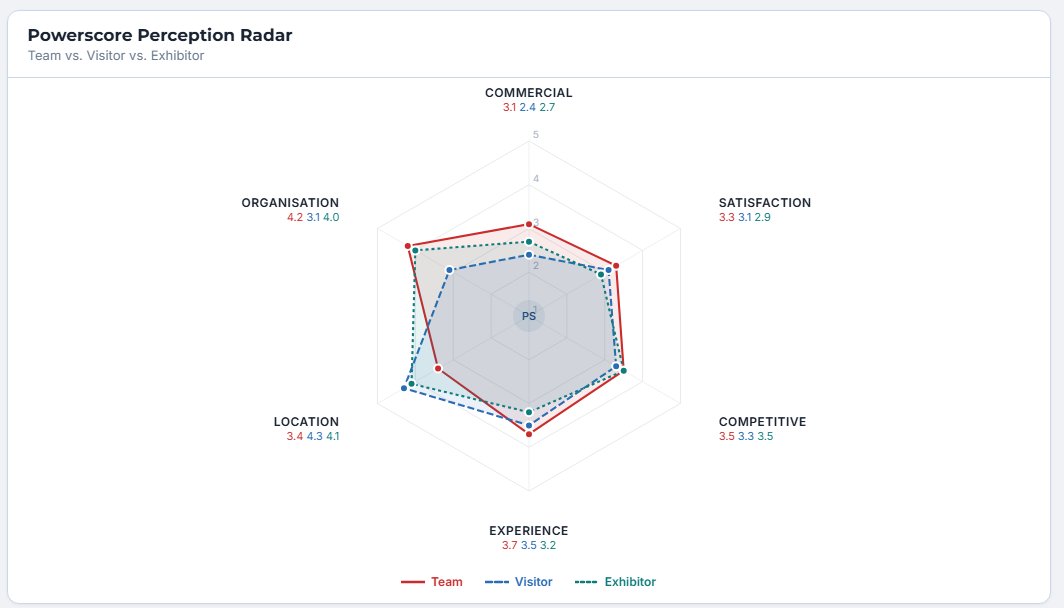
Six performance dimensions measured across three audiences: exhibitors, visitors, and your internal team. Gaps in perception become visible. Patterns become actionable.
Every event plotted by Show Strength against Market Confidence. Position is the strategy: an event's quadrant tells you whether to invest, rework, hold or rethink before a single page of detail is opened.
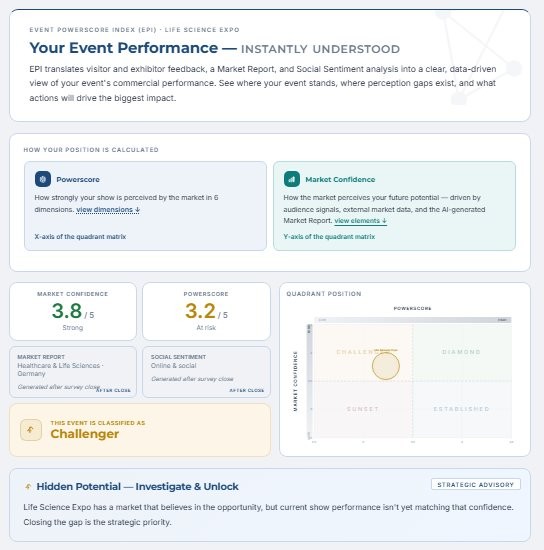
The single-event view shows the Show Strength and Market Confidence signals side by side, with the event's classification and a plain-language read of what the combination means, so you walk into the next leadership conversation already knowing where the event stands.
Here the spread matters more than the shape. Where team, visitor and exhibitor lines diverge, you've found a perception gap, and that is usually where the next conversation needs to start.
Individual shows. Portfolio clusters. The corporate view. The picture looks different depending on where you’re standing. EPI gives you a consistent lens across all three.
The board wants signals. Revenue and attendance tell you what happened. EPI tells you what's likely to happen next. A performance index across your entire portfolio, structured for leadership conversations.
Comparing events across regions, sectors, or formats is difficult when each show generates different data in different ways. EPI creates a common language across your portfolio. Consistent. Comparable. Clear.
At the individual event level, the picture is richer and more complex. The show's commercial health, competitive position, exhibitor confidence, and visitor intent. EPI brings all of it into a single, structured output.
Show Strength distils live feedback from the floor into a single reading: how strong your show is in the minds of the people inside it. Each dimension is scored from three distinct viewpoints: exhibitor, visitor, and your own team. That goes deeper than satisfaction, and it shows you exactly where perceptions diverge. It’s one half of the index.

Show Strength tells you how your event performs in the eyes of the people inside it. It’s one marker, but not the whole story. Every show sits inside a market with its own trajectory, so EPI captures a second signal: Market Confidence, how the people trading in that sector see its direction. Neither signal means much on its own. Read together, they become the Event Powerscore Index, the combined picture of show strength and market trajectory that actually determines long-term event health.
The market is there; the proposition needs work. Often the most valuable position in a portfolio, if you can see it for what it is.
ChallengerThe index confirms what the floor is telling you. Stakeholders are committed and the market is moving with you. Invest with confidence.
DiamondNeither the show nor its market is where it needs to be. Not a verdict but a prompt: rework the format, reposition the proposition, or redirect that energy to where it can compound.
SunsetThe event is performing, but the ground beneath it is shifting. Stakeholder perception alone would never show you this; the combined reading does.
EstablishedShow Strength reads the show. Market Confidence reads the market.
The Index is what they tell you together.
A simple, controlled process that captures live event feedback while the show is still open.
We set up the EPI framework around your event, portfolio, audiences, and reporting needs.
Brief your onsite team to capture exhibitor, visitor, and staff feedback during the show using tablets or QR links.
Daily interim reports show response volumes, patterns, and emerging signals while the event is still running.
You receive your Powerscore index, perception profile, commercial recommendations, and benchmarking view where applicable.
Powerscore is designed to capture feedback while the show is still running — when exhibitors, visitors, and staff are present, engaged, and able to respond.
“We ran Powerscore across three of our shows this May — ODBW, OPES and OSW — and the Event Powerscore Index gave us strategic insight into show performance we simply haven’t had before. Having portfolio-level visibility across our events, with real-time scoring and AI-generated narrative analysis, is a step-change for how we’ll manage and grow these brands. My team worked closely with Powerscore onsite, and their support for managing survey staff made the rollout genuinely smooth.”
Your first index can be live in weeks. No data transfer. No integration. Just a new way to see your events and your portfolio with the structure and confidence to act on what you find.